About the Trauma Service
St George Hospital received over 1,800 presentations due to serious injury in 2014. These are only a small portion of the 66507 patients that attended our emergency department, one of the busiest in NSW. As a Level 1 Trauma Service, St George Hospital provides all clinical specialties including Trauma Rehabilitation services. Of the nearly 2,000 major trauma patients the St. George Hospital Trauma Team evaluates each year 327 have sustained serious, life-threatening injuries and generally required intensive care, operative and extensive recovery and rehabilitation care (Injury Severity Score greater than 12). In addition to being a major trauma service, St George Hospital is the first hospital in Australia to implement a dedicated admitting trauma team which reduced mortality, and one of the first to incorporate a Trauma Case Management Program which increases efficiency, reduces length of stay, and minimises complications among admitted patients.
Further information on the levels of trauma services can be found at the NSW Institute of Trauma and Injury Management Website http://www.itim.nsw.gov.au.
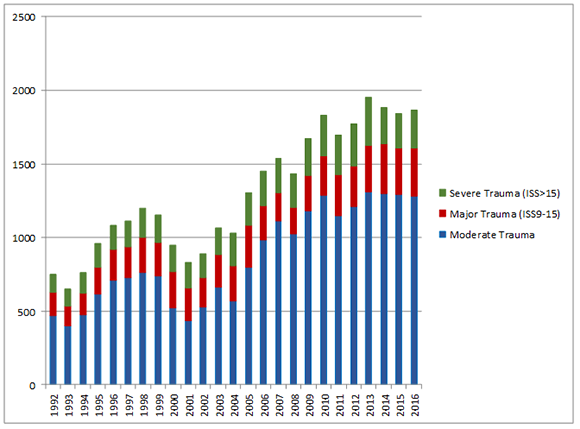
24 years of Trauma at St George
Since trauma monitoring commenced at SGH in 1992 there has been a 149% increase in trauma presentations. These are patients who have filled trauma call criteria and required a hospital wide response.
| Key Statistics | |||||||
| Time Period | 2010 | 2011* | 2012 | 2013 | 2014 | 2015 | 2016 |
| Total Presented | 1831 | 1696 | 1772 | 1952 | 1884 | 1842 | 1865 |
| Total Admitted | 1089 | 1064 | 1111 | 1306 | 1260 | 1198 | 1234 |
| Total Deat | 46 | 47 | 36 | 49 | 53 | 33 | 48 |
| Total IHT | 151 | 171 | 187 | 183 | 190 | 164 | 208 |
| ICU Admissions | 162 | 142 | 156 | 137 | 134 | 126 | |
| Time Period | 2010 | 2011 | 2012 | 2013 | 2014 | 2015 | 2016 |
| Fall: <1 metres | 95 | 163 | 206 | 263 | 331 | 282 | 329 |
| Fall: 1-5 metres | 333 | 238 | 221 | 269 | 256 | 270 | 245 |
| Fall: >5 metres | 19 | 61 | 26 | 26 | 20 | 23 | 29 |
| Fall: Height Unknown | 17 | 6 | 5 | 5 | 3 | 3 | |
| MVC | 719 | 613 | 645 | 668 | 577 | 574 | 568 |
| MBC | 165 | 144 | 182 | 187 | 179 | 178 | 177 |
| Other MVC | 7 | 18 | 22 | 20 | 20 | 21 | 25 |
| Pedestrian | 131 | 138 | 119 | 133 | 123 | 118 | 119 |
| Pedal cyclist | 120 | 118 | 109 | 137 | 108 | 96 | 98 |
| Assault | 69 | 56 | 65 | 57 | 51 | 60 | 68 |
| Stabbing | 35 | 35 | 35 | 51 | 48 | 47 | 49 |
| Sporting Injury | 21 | 10 | 19 | 17 | 17 | 21 | 9 |
| Burns | 26 | 10 | 26 | 20 | 19 | 21 | 21 |
| Water Sport/Boating | 11 | 26 | 23 | 19 | 44 | 29 | 38 |
| Industrial injury | 18 | 5 | 19 | 19 | 22 | 12 | 20 |
| Gunshot wound | 4 | 4 | 10 | 4 | 6 | 4 | 3 |
| Horse riding incident | 5 | 5 | 4 | 4 | 12 | 14 | 19 |
| Railway/train incident | 2 | 5 | 2 | 5 | 0 | 3 | 4 |
| Other (incl. skateboard, rollerblades, aircraft) | 13 | 30 | 33 | 48 | 46 | 66 | 41 |
| Time Period | 2010 | 2011 | 2012 | 2013 | 2014 | 2015 | 2016 |
| < 9 (minor) | 1288
(70.3%) |
1150 (67.8%) |
1210 (68.3%) |
1312 (67.2%) |
1298 (68.9%) |
1293 (70.2%) |
1280 (68.6%) |
| 9-12 (moderate) |
ISS>12 is NSW definition of severe trauma from 2011 |
191 (11.3%) |
200 (11.3%) |
221 (11.3%) |
259 (13.7%) |
240 (13.0%) |
249 (13.4%) |
| 13-15 (major) | 87 (5.1%) |
73 (4.1%) |
95 (4.9%) |
78 (4.1%) |
76 (4.1%) |
80 (4.3%) |
|
| 9-15 (major) | 266
(14.5%) |
278 (16.4%) |
273 (15.4%) |
316 (16.2%) |
337 (17.9%) |
316 (17.2%) |
329 (17.6%) |
| > 15 (severe) | 277
(15.1%) |
268 (15.8%) |
289 (16.3%) |
324 (16.6%) |
249 (13.2%) |
233 (12.6%) |
256 (13.7%) |
* In 2011 we changed databases to the NSW state-wide system – “Collector”, resulting in several coding changes.